Visualizing Application Status using Amazon QuickSight
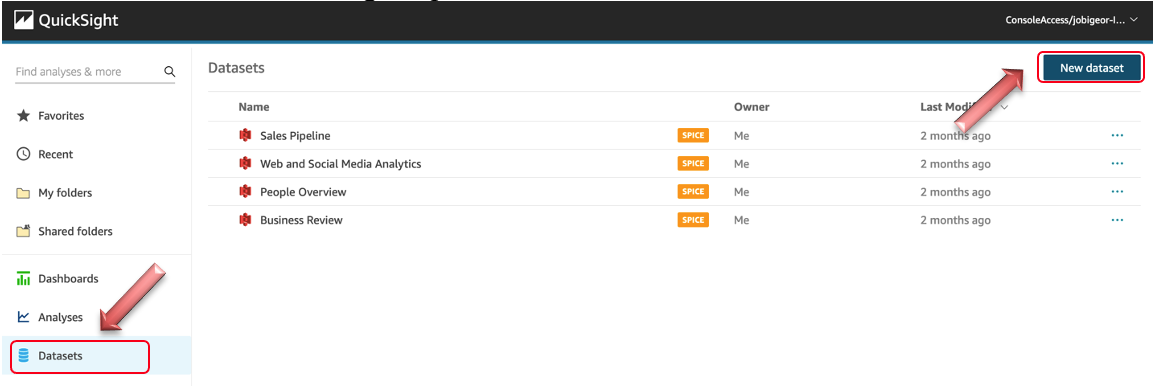
Navigate to Amazon QuickSight dataset page to start create a dataset from Amazon Redshift. click on New dataset on the right top corner.
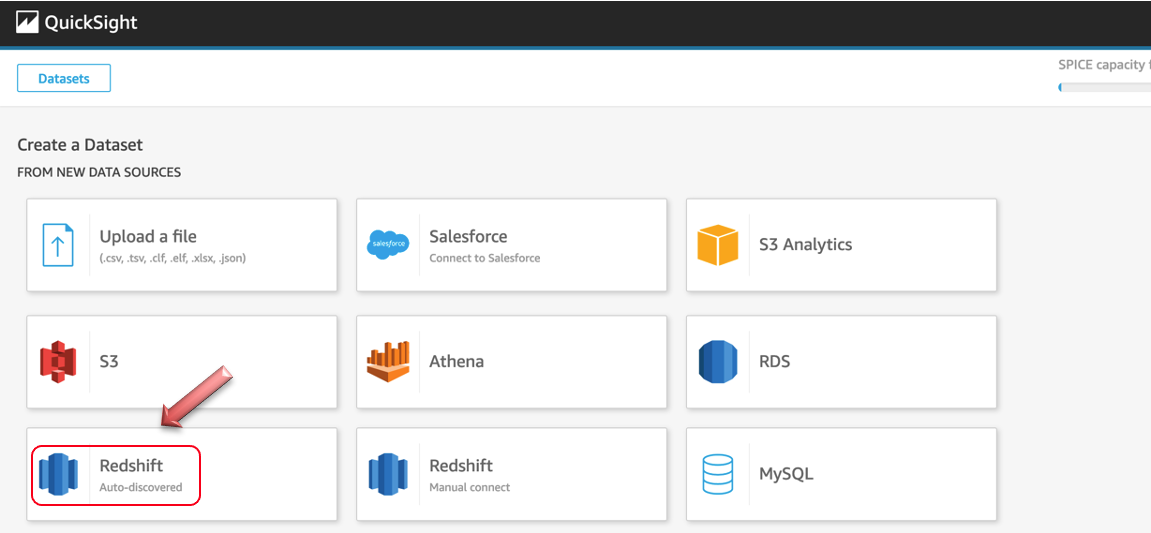
Select Redshift Auto-discovered from the option, like shown below:
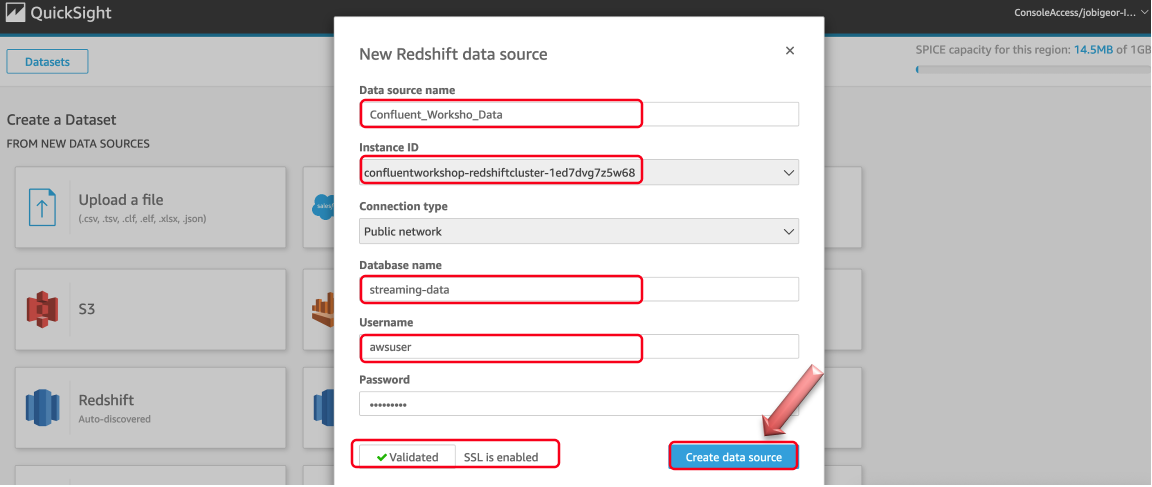
On the next page, provide below details and make sure validation is successful and then click “Create data source”
| Key | Value |
|---|---|
| Data source name | Confluent_Workshop_Data |
| Instance ID | Select Your Cluster from Dropdown |
| Connection type | Public Network |
| Database name | streaming-data |
| Username | awsuser |
| Password | Awsuser01 |
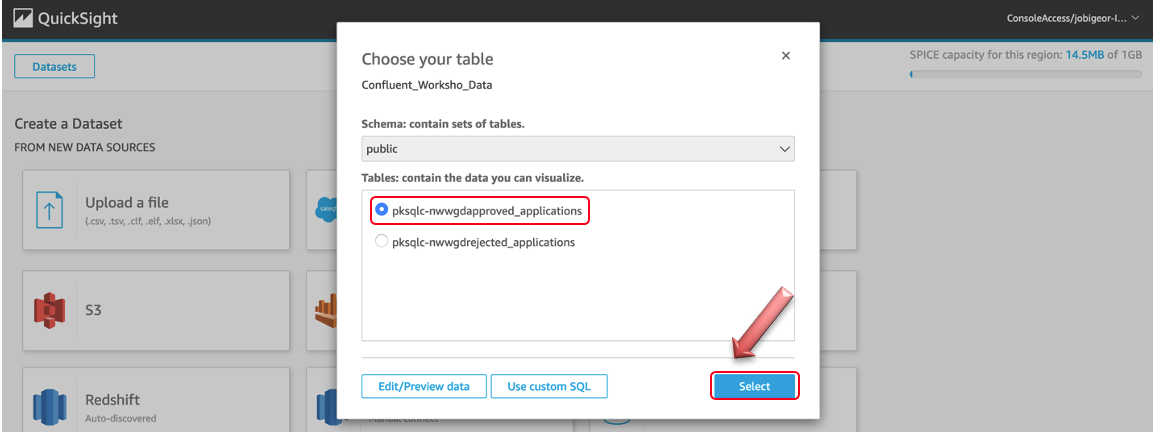
On the next page, select pksql-xxxxxapproved_application from the list and click Select
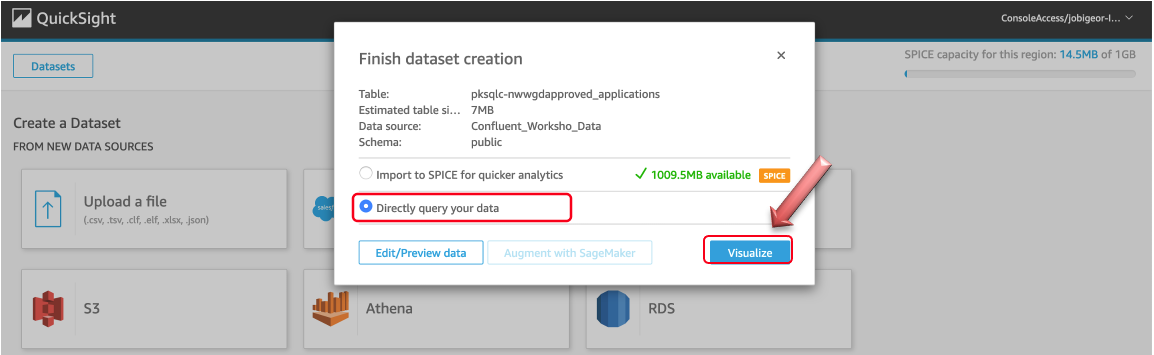
Select Directly query the data and click Visualize button to start some basic visualization creation using Amazon QuickSight:
On the next page, Click on Pie Chart to create a basic visualization, for Group, drag and drop credit_type and for Value drag and drop amount to get a visualization which shows different types of Credit application types and sum of the amount approved. Hove over the pie will show you the total amount like show in the screenshot below:

We are just creating a sample visualization as above, you can repeat the steps for visualizing rejected applications similarly.
Also, you can learn more about how to create multi visual analysis and dashboards using Amazon QuickSight with the help of this Tutorial
This is the last section of this workshop, now lets go ahead and clean-up.